Note
Go to the end to download the full example code.
Parabola to quadratic Bézier curve conversion
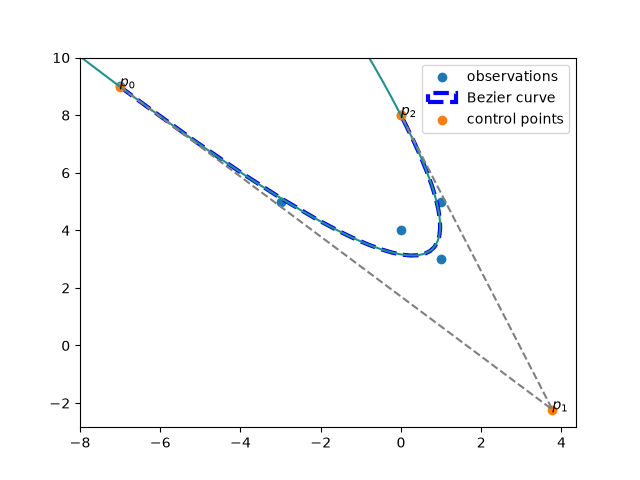
A parabola can be represented exactly by a quadratic (second-degree) Bézier curve. This example fits a parabola to a set of observations and converts the result into the corresponding Bézier control points.
from conics import Parabola
from conics.fitting import fit_nievergelt
from conics.fitting import parabola_to_bezier
import matplotlib.patches as mpatches
import matplotlib.pyplot as plt
import numpy as np

x = [-7, -3, 0, 0, 1, 1]
y = [9, 5, 4, 8, 3, 5]

pts = np.column_stack((x, y))

C = fit_nievergelt(pts, type='parabola', scale=True)
pb = Parabola.from_conic(C)

control_points = parabola_to_bezier(pb, *pts[[0, -3]])
s1, inter, s2 = control_points

X, Y = np.meshgrid(
    np.linspace(np.min(x) - 1, np.max(x) + 1),
    np.linspace(-1 + np.min(y), np.max(y) + 1),
)
Z = C(np.dstack([X, Y]))

fig = plt.figure()

plt.contour(X, Y, Z, levels=0)

plt.scatter(*pts.T, label='observations')

path = mpatches.Path(
    control_points, [mpatches.Path.MOVETO, mpatches.Path.CURVE3, mpatches.Path.CURVE3]
)
pp = mpatches.PathPatch(
    path, fill=False, linestyle='--', edgecolor='blue', lw=3, label='Bezier curve'
)

plt.gca().add_patch(pp)

plt.plot(*control_points.T, '--', c='gray')
plt.scatter(*control_points.T, label='control points')

for i, xy in enumerate(control_points):
    plt.annotate('$p_{}$'.format(i), xy)

plt.legend()

plt.show()
Total running time of the script: (0 minutes 0.444 seconds)