Note
Go to the end to download the full example code.
Fitting and non-linear refinement of a parabola
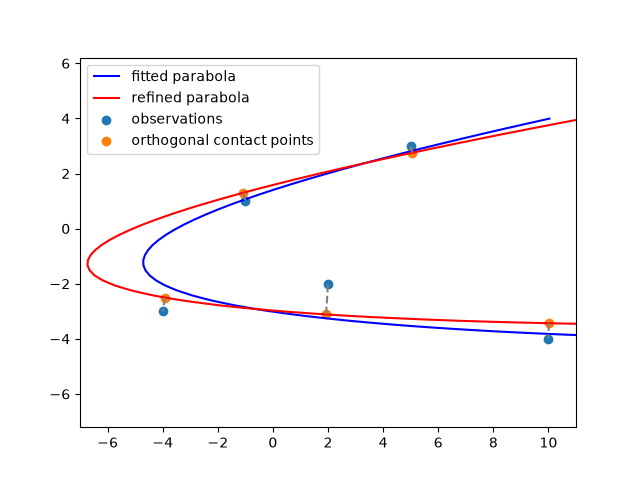
This example shows a linearly fitted parabola and its non-linear refined variant.
from conics import Parabola
from conics.fitting import fit_nievergelt
import matplotlib.pyplot as plt
import numpy as np

x = [-1, 2, 5, 10, -4]
y = [1, -2, 3, -4, -3]

pts = np.column_stack((x, y))

C = fit_nievergelt(pts, type='parabola', scale=False)

X, Y = np.meshgrid(
    np.linspace(np.min(x) - 3, np.max(x) + 1),
    np.linspace(-1 + np.min(y), np.max(y) + 1),
)
Z = C(np.dstack([X, Y]))

p = Parabola.from_conic(C)

p_refined = p.refine(pts)
C_refined = p_refined.to_conic()

contact_pts = p_refined.contact(pts)

Z_refined = C_refined(np.dstack([X, Y]))

plt.figure()
plt.axis('equal')

cs = plt.contour(X, Y, Z, colors='blue', levels=[0])
artists1, _ = cs.legend_elements()

cs_refined = plt.contour(X, Y, Z_refined, colors='red', levels=[0])
artists2, _ = cs_refined.legend_elements()

plt.scatter(x, y, label='observations')

for xy in np.dstack((contact_pts, pts)):
    plt.plot(*xy, '--', c='gray')

plt.scatter(*contact_pts.T, label='orthogonal contact points')

a, l = plt.gca().get_legend_handles_labels()

plt.legend(artists1 + artists2 + a, ['fitted parabola', 'refined parabola'] + l)
plt.show()
Total running time of the script: (0 minutes 0.259 seconds)