Note
Go to the end to download the full example code.
Conic-line intersections
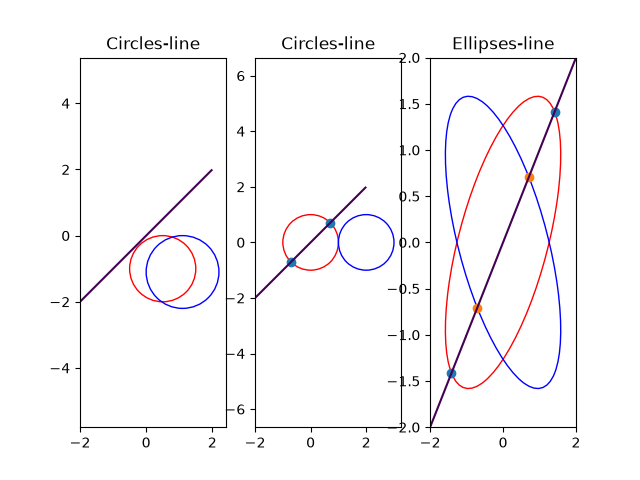
This example computes the intersections of a line with several pairs of conics: two overlapping circles, two circles touching at a single point, and two ellipses sharing the same center but with different orientations.
from conics import Conic
from conics.geometry import hnormalized
from matplotlib.patches import Ellipse
import matplotlib.pyplot as plt
import numpy as np


def as_ellipse(c, **kwargs):
    x0, major_minor, angle = c.to_ellipse()
    return Ellipse(
        x0.ravel(), *major_minor.ravel() * 2, angle=np.rad2deg(angle), **kwargs
    )


c1 = Conic.from_circle([0.5, -1], 1)
c2 = c1.translate([0.5, 0]).scale(1.1)

e1 = Conic.from_ellipse([0, 0], [2, 1], np.pi / 4)
e2 = Conic.from_ellipse([0, 0], [2, 1], np.pi * 3 / 4)

c3 = Conic.from_circle([0, 0], 1)
c4 = c3.translate([2 * 1, 0])

alpha = np.deg2rad(-45)
l = np.array([np.cos(alpha), np.sin(alpha), 0])

x = np.linspace(-2, 2)
y = np.linspace(-2, 2)

X, Y = np.meshgrid(x, y)
Z_l = np.dot(np.dstack([X, Y]), l[:-1]) + l[-1]

inter11 = hnormalized(c1.intersect_line(l))
inter12 = hnormalized(c2.intersect_line(l))

inter21 = hnormalized(c3.intersect_line(l))
inter22 = hnormalized(c4.intersect_line(l))

inter31 = hnormalized(e1.intersect_line(l))
inter32 = hnormalized(e2.intersect_line(l))

fig = plt.figure()
ax1, ax2, ax3 = fig.subplots(1, 3)

ax1.set_title('Circles-line')
ax1.add_patch(as_ellipse(c1, facecolor='none', edgecolor='red'))
ax1.add_patch(as_ellipse(c2, facecolor='none', edgecolor='blue'))
ax1.contour(X, Y, Z_l, levels=[0])
ax1.scatter(*inter11.T)
ax1.scatter(*inter12.T)

ax2.set_title('Circles-line')
ax2.add_patch(as_ellipse(c3, facecolor='none', edgecolor='red'))
ax2.add_patch(as_ellipse(c4, facecolor='none', edgecolor='blue'))
ax2.contour(X, Y, Z_l, levels=[0])
ax2.scatter(*inter21.T)

ax3.set_title('Ellipses-line')
ax3.add_patch(as_ellipse(e1, facecolor='none', edgecolor='red'))
ax3.add_patch(as_ellipse(e2, facecolor='none', edgecolor='blue'))
ax3.contour(X, Y, Z_l, levels=[0])
ax3.scatter(*inter31.T)
ax3.scatter(*inter32.T)

ax1.axis('equal')
ax2.axis('equal')

plt.show()
Total running time of the script: (0 minutes 0.292 seconds)